9 กันยายน 2568 ByteDance เปิดตัว Seedream 4.0 AI Multimodal image model ที่รวม Text-to-Image + SeedEdit ไว้ชุดเดียว ออกแบบภาพ แต่งภาพแบบมืออาชีพได้ดีมาก วันนี้มายกตัวอย่าง Use Case ที่หินที่สุดในประวัติศาสตร์ AI โลกกับ การสร้าง Chart, Diagram หรือ Infographic ด้วย Prompt เดียว (ส่วนใหญ่เป็น Text to Image) รองรับจีน-อังกฤษ เพียง 2 ภาษา
รายชื่อ Use Case
1. สร้างภาพ Pyramid Model ได้ เช่น Data Pyramid Model

- ไม่ต้องอัพโหลดภาพเลย ใส่ Prompt เท่านั้น
Prompt: Create a high-density educational poster of the “Data Pyramid Model” with four stacked layers titled “Data”,”Information”, “Knowledge”, “Wisdom”.
Purpose: teaching aid for executives.
Layout: a clean vertical pyramid with clear layer dividers, left-aligned callouts, and iconography per layer.
Style: modern corporate, flat vectors with soft shadows, grid-aligned typography.
Color palette: cool blues ascending to warm gold at the top.
Add a small subtitle: “From Raw Data to Actionable Wisdom”.
Output: –aspect 3:4 for social media.
Include concise bullets inside 4 layers:
- “Data: raw facts, signals, unprocessed logs”
- “Information: data + context/structure, aggregated summaries”
- “Knowledge: interpreted patterns, cause–effect, actionable insights”
- “Wisdom: judgment/principles guiding decisions”
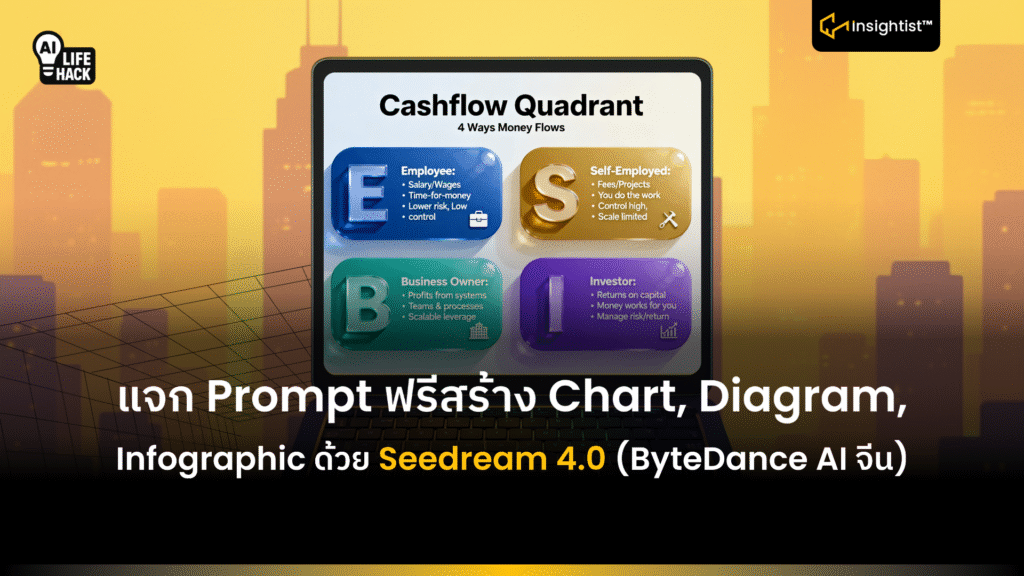
2. สร้างตาราง 4 ช่อง อย่างการเงิน รายได้ 4 ช่องทาง (E,S,B,I Income)

- ไม่ต้องอัพโหลดภาพเลย ใส่ Prompt เท่านั้น
Prompt: Create a premium poster of the Cashflow Quadrant with four rounded cards arranged in a 2×2 grid. Big letters E S B I on each card, soft shadows, subtle gradients, glassy highlights.
Color map: E=Royal Blue, S=Amber, B=Emerald, I=Violet.
Title: ‘Cashflow Quadrant’ centered on top; small subtitle: ‘4 Ways Money Flows’.
Place the following bullet summaries on each card:
- E — Employee: Salary/Wages • Time-for-money • Lower risk, Low control
- S — Self-Employed: Fees/Projects • You do the work • Control high, Scale limited
- B — Business Owner: Profits from systems • Teams & processes • Scalable leverage
- I — Investor: Returns on capital • Money works for you • Manage risk/return
Use small icons and consistent spacing; export 4K vertical.
3. สร้างแผนภูมิวงกลม (PIE Chart)

- ไม่ต้องอัพโหลดภาพเลย ใส่ Prompt เท่านั้น
Prompt: Design a pie chart for the ‘Sufficiency Economy 30–30–30–10 allocation’.
Use Thai-inspired colors and subtle pattern (green & gold accents). Pie/Donut Chart with 4 equal slices
Slices and texts (English):
- Essentials – 30% (3/10 Pie Chart’s area)
- Savings/Reserves – 30% (3/10 Pie Chart’s area)
- Investments/Development – 30% (3/10 Pie Chart’s area)
- Giving/Community – 10% (1/10 Pie Chart’s area)
Place percentages on the chart, add minimalist line icons per slice, and a small caption below:
‘Moderation • Reasonableness • Self-Immunity — with Knowledge & Integrity.’
Neat layout, generous white space, print-ready.
– aspect 3:4
4. ภาพ Timeline แนวตั้ง แนวนอน อย่างประวัติศาสตร์ไทย ตั้งแต่สมัยสุโขทัย-รัตนโกสินทร์

- ไม่ต้องอัพโหลดภาพเลย ใส่ Prompt เท่านั้น
Prompt: Draw a timeline from the Sukhothai Kingdom to the Rattanakosin Kingdom. Mark the Sukhothai, Ayutthaya, Thonburi, Rattanakosin Kingdom in a clear order. Each Kingdom should be accompanied by a small icon, and the characteristics of each Kingdom should be written in English.
- ภาพต่ออไป พีคสุด ไม่มี AI ตัวไหนทำได้ใกล้เคียงเท่านี้มาก่อน
5. ภาพกราฟเชิงเส้น (กราฟอัตราแลกเปลี่ยนเงินดอลลาร์สหรัฐกับเงินบาท ของเดือนกันยายน 2568)
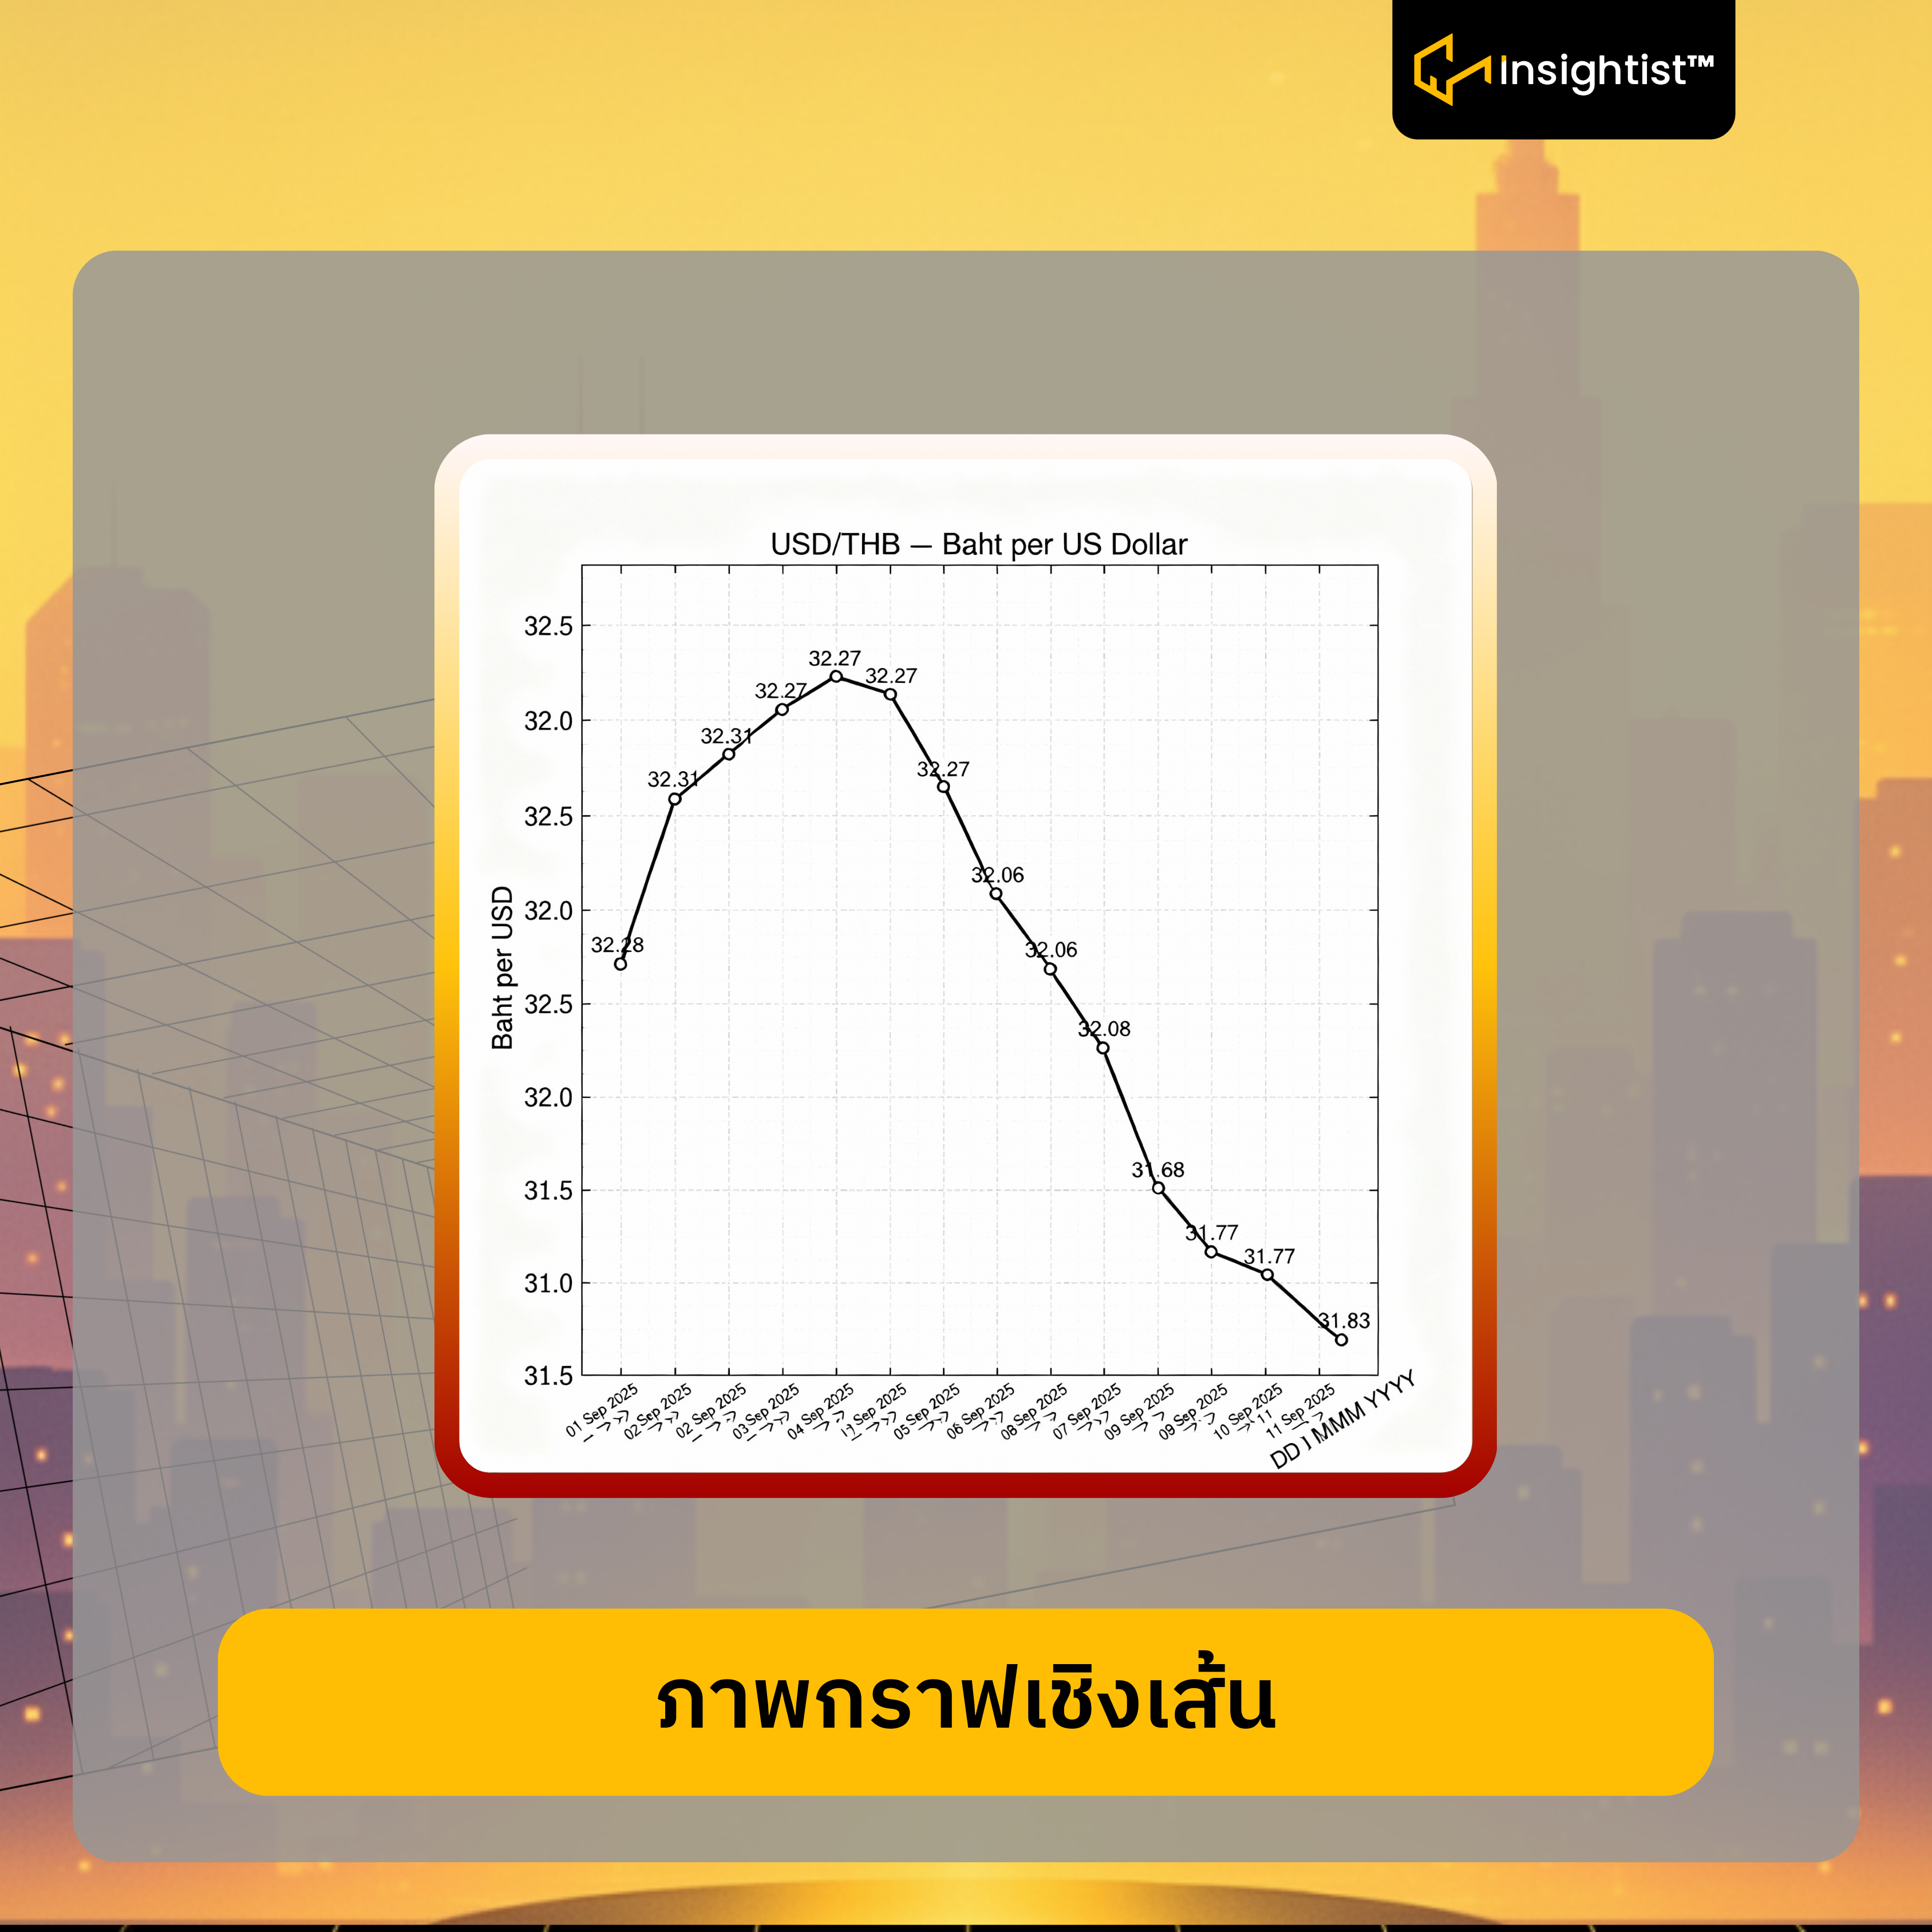
- ไม่ต้องอัพโหลดภาพเลย ใส่ Prompt เท่านั้น
Prompt: Create a horizontal line chart titled ‘USD/THB — Baht per US Dollar’.
Axes: X = Baht per USD (value), Y = Date (DD MMM YYYY) in chronological order from top to bottom.
–aspect 16:9, clean style, thin gridlines, circular markers on each point.
Single-series rule (very important):
Draw one polyline connecting all data points from 01 Sep 2025 to 11 Sep 2025 in date order. Do not split into multiple lines; no gaps, no smoothing—straight segments only.
Segment direction rule:
- If the latter value < the previous value, the curve must slope upwards to the right (lower baht/US dollar).
- If the latter value > the previous value, the curve must slope downwards to the right (higher baht/US dollar).
- If the values are equal, the curve becomes a horizontal line (original X).
Axes setup:
- Y-axis: numeric scale 31.5–32.5, ticks every 0.1, label ‘Baht per USD’.
- X-axis: dates 01–11 Sep 2025 (BE 2568), format DD MMM YYYY.
Data (X=date → Y=value):
01 Sep 2025 → 32.28
02 Sep 2025 → 32.31
03 Sep 2025 → 32.27
04 Sep 2025 → 32.27
05 Sep 2025 → 32.06
06 Sep 2025 → 32.06
07 Sep 2025 → 32.08
08 Sep 2025 → 31.68
09 Sep 2025 → 31.77
10 Sep 2025 → 31.77
11 Sep 2025 → 31.83
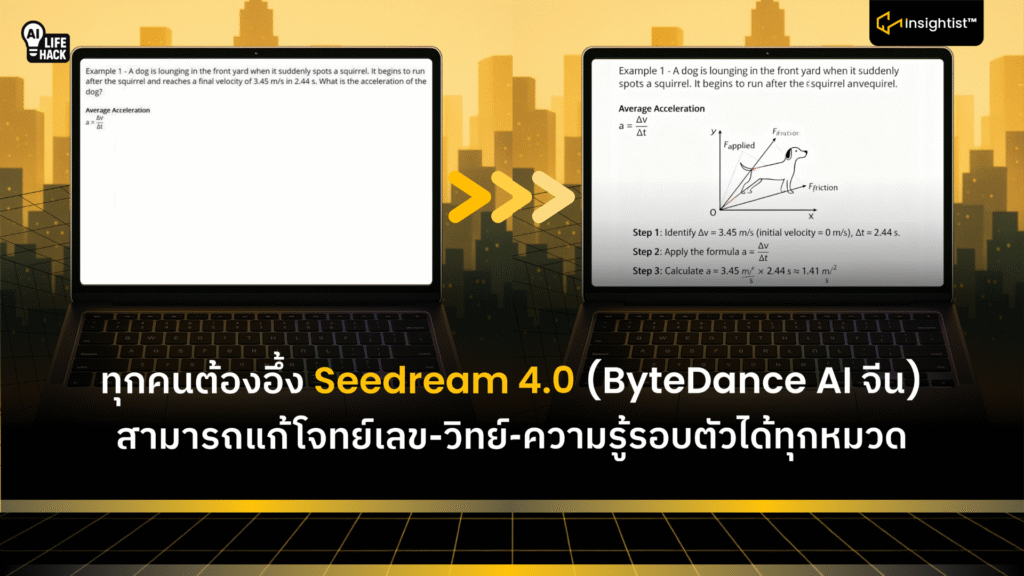
6. ถอดรหัสแก้ไขโจทย์เลข-วิทย์ได้ด้วย Prompt 1 Prompt

- อัพโหลดภาพ หากว่า มีสัญลักษณ์ทางคณิต-วิทย์ที่ซับซ้อน และเนื้อหากับภาพต้องสอดคล้องกัน
Prompt: Draw the following system of Laplace transform and the corresponding solution steps on the whiteboard:
สามารถดูได้ในภาพครับ
ข้อสรุป:
นี่คือ ความน่ากลัวของ Seedream 4.0 ครับที่โหดกว่า Gemini Nano Banana